Blog/Analysis
Bi_Focal #21: Four lessons from a year in research
By James Kanagasooriam, Chief Research Officer; Patrick Flynn, Data Journalist; and Manon Allen, Growth Manager
All the way back in February, we published a piece predicting that Reform UK would pose a substantial challenge to the Conservatives in any future election, though not along the lines of a Canada 1993 156-to-2-seats-style wipeout. On that, we were right! Through the rest of this year, we have published over a dozen further pieces, from election post-mortems to critical analyses on opinion research methods like MRP and qual research at-scale. We were first out of the gates with our demographic breakdown of the 2024 election, and also put out a landmark study on the attitudes of Britain’s ethnic minorities.
Looking back, not all our predictions this year were proved as right as the February one, however. So by way of rounding off 2024 and in the spirit of self-reflection, we’ve compiled some lessons and observations from a year watching politics and opinion polling. Strap in!
The UK election was a victory for industry innovators
We took a ‘meta pollster’ approach this year, keeping track of the industry and commenting from within on what we thought the industry was doing well and where it could improve. Many of our innovative approaches were vindicated.
We correctly assessed that Labour’s lead was likely overstated by pollsters making no adjustments for seemingly undecided voters, who disproportionately broke against Labour when pushed. This decision strikes at the heart of an existential question of what polls are supposed to measure, but we will continue to take the approach we do given the role polls play in contemporary discussions.
Likewise, we spotted early on that MRP’s tendency to flatten out vote distributions – known as attenuation bias – was likely underestimating the number of seats the Conservatives would win. Despite most other MRPs predicting a Conservative seat count below 100, our research suggested such an outcome was fairly unlikely. With developments to our model using a method variously called ‘unwinding’ and ‘re-regression’ in different circles, our final MRP poll called just one fewer seat correct than the on-the-night exit poll – pretty good going!
Out with polling averages, in with averages of methods?
2024 proved what we had suspected for a while – the current polling paradigm is well and truly dead. With two high-profile polling misses in the UK and US, it’s clear that alternative methods and technologies are needed to address contemporary research challenges. Despite improvements to sampling and weighting since 2016, non-response bias – the bias introduced by certain groups being unable or unwilling to take polls – still plagues the industry, and may be getting worse. How can traditional methods still work if support for a particular candidate is highly correlated with low institutional trust, and therefore with people who are less likely to show up in polling samples? We predicted that the polls might underestimate Trump again back in September, with most traditional polls still relying on self-reported likelihood to vote, but this did not cover the errors associated with non-response bias.
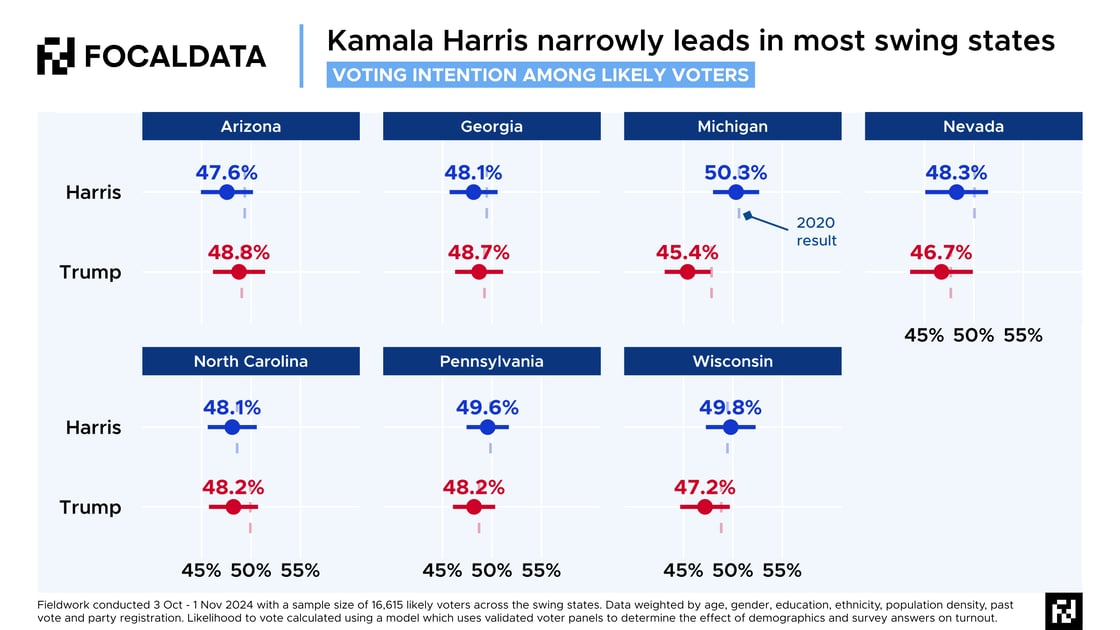
At a basic level, the industry should improve its communication of margins of error and probability – notably with better visualisation techniques (e.g. the dot-and-whisker plots below). With margins of error hovering at around 2.5 percentage points for a typical poll at the best of times, even a perfectly-calibrated survey with no non-response bias and no weighting required could easily show a candidate leading by 2 points and losing on the day by 2 points.

The industry’s ineffective communication on margins of error meant that many commentators misinterpreted what the polls were saying. As we noted before the election, a hard-to-call election did not necessarily mean the election would be close in the Electoral College.
But there is also something more problematic at work. It’s no coincidence that Donald Trump has now outperformed his polling averages in all three US presidential elections. Our attempts to control for non-response bias in creative ways (see quota-ing and weighting by vaccination status, political attention, preferred news outlet) can never completely offset the missing voters in our samples – known in the industry as ‘nonignorable nonresponse’, which I’m sure you’ll agree really rolls off the tongue.
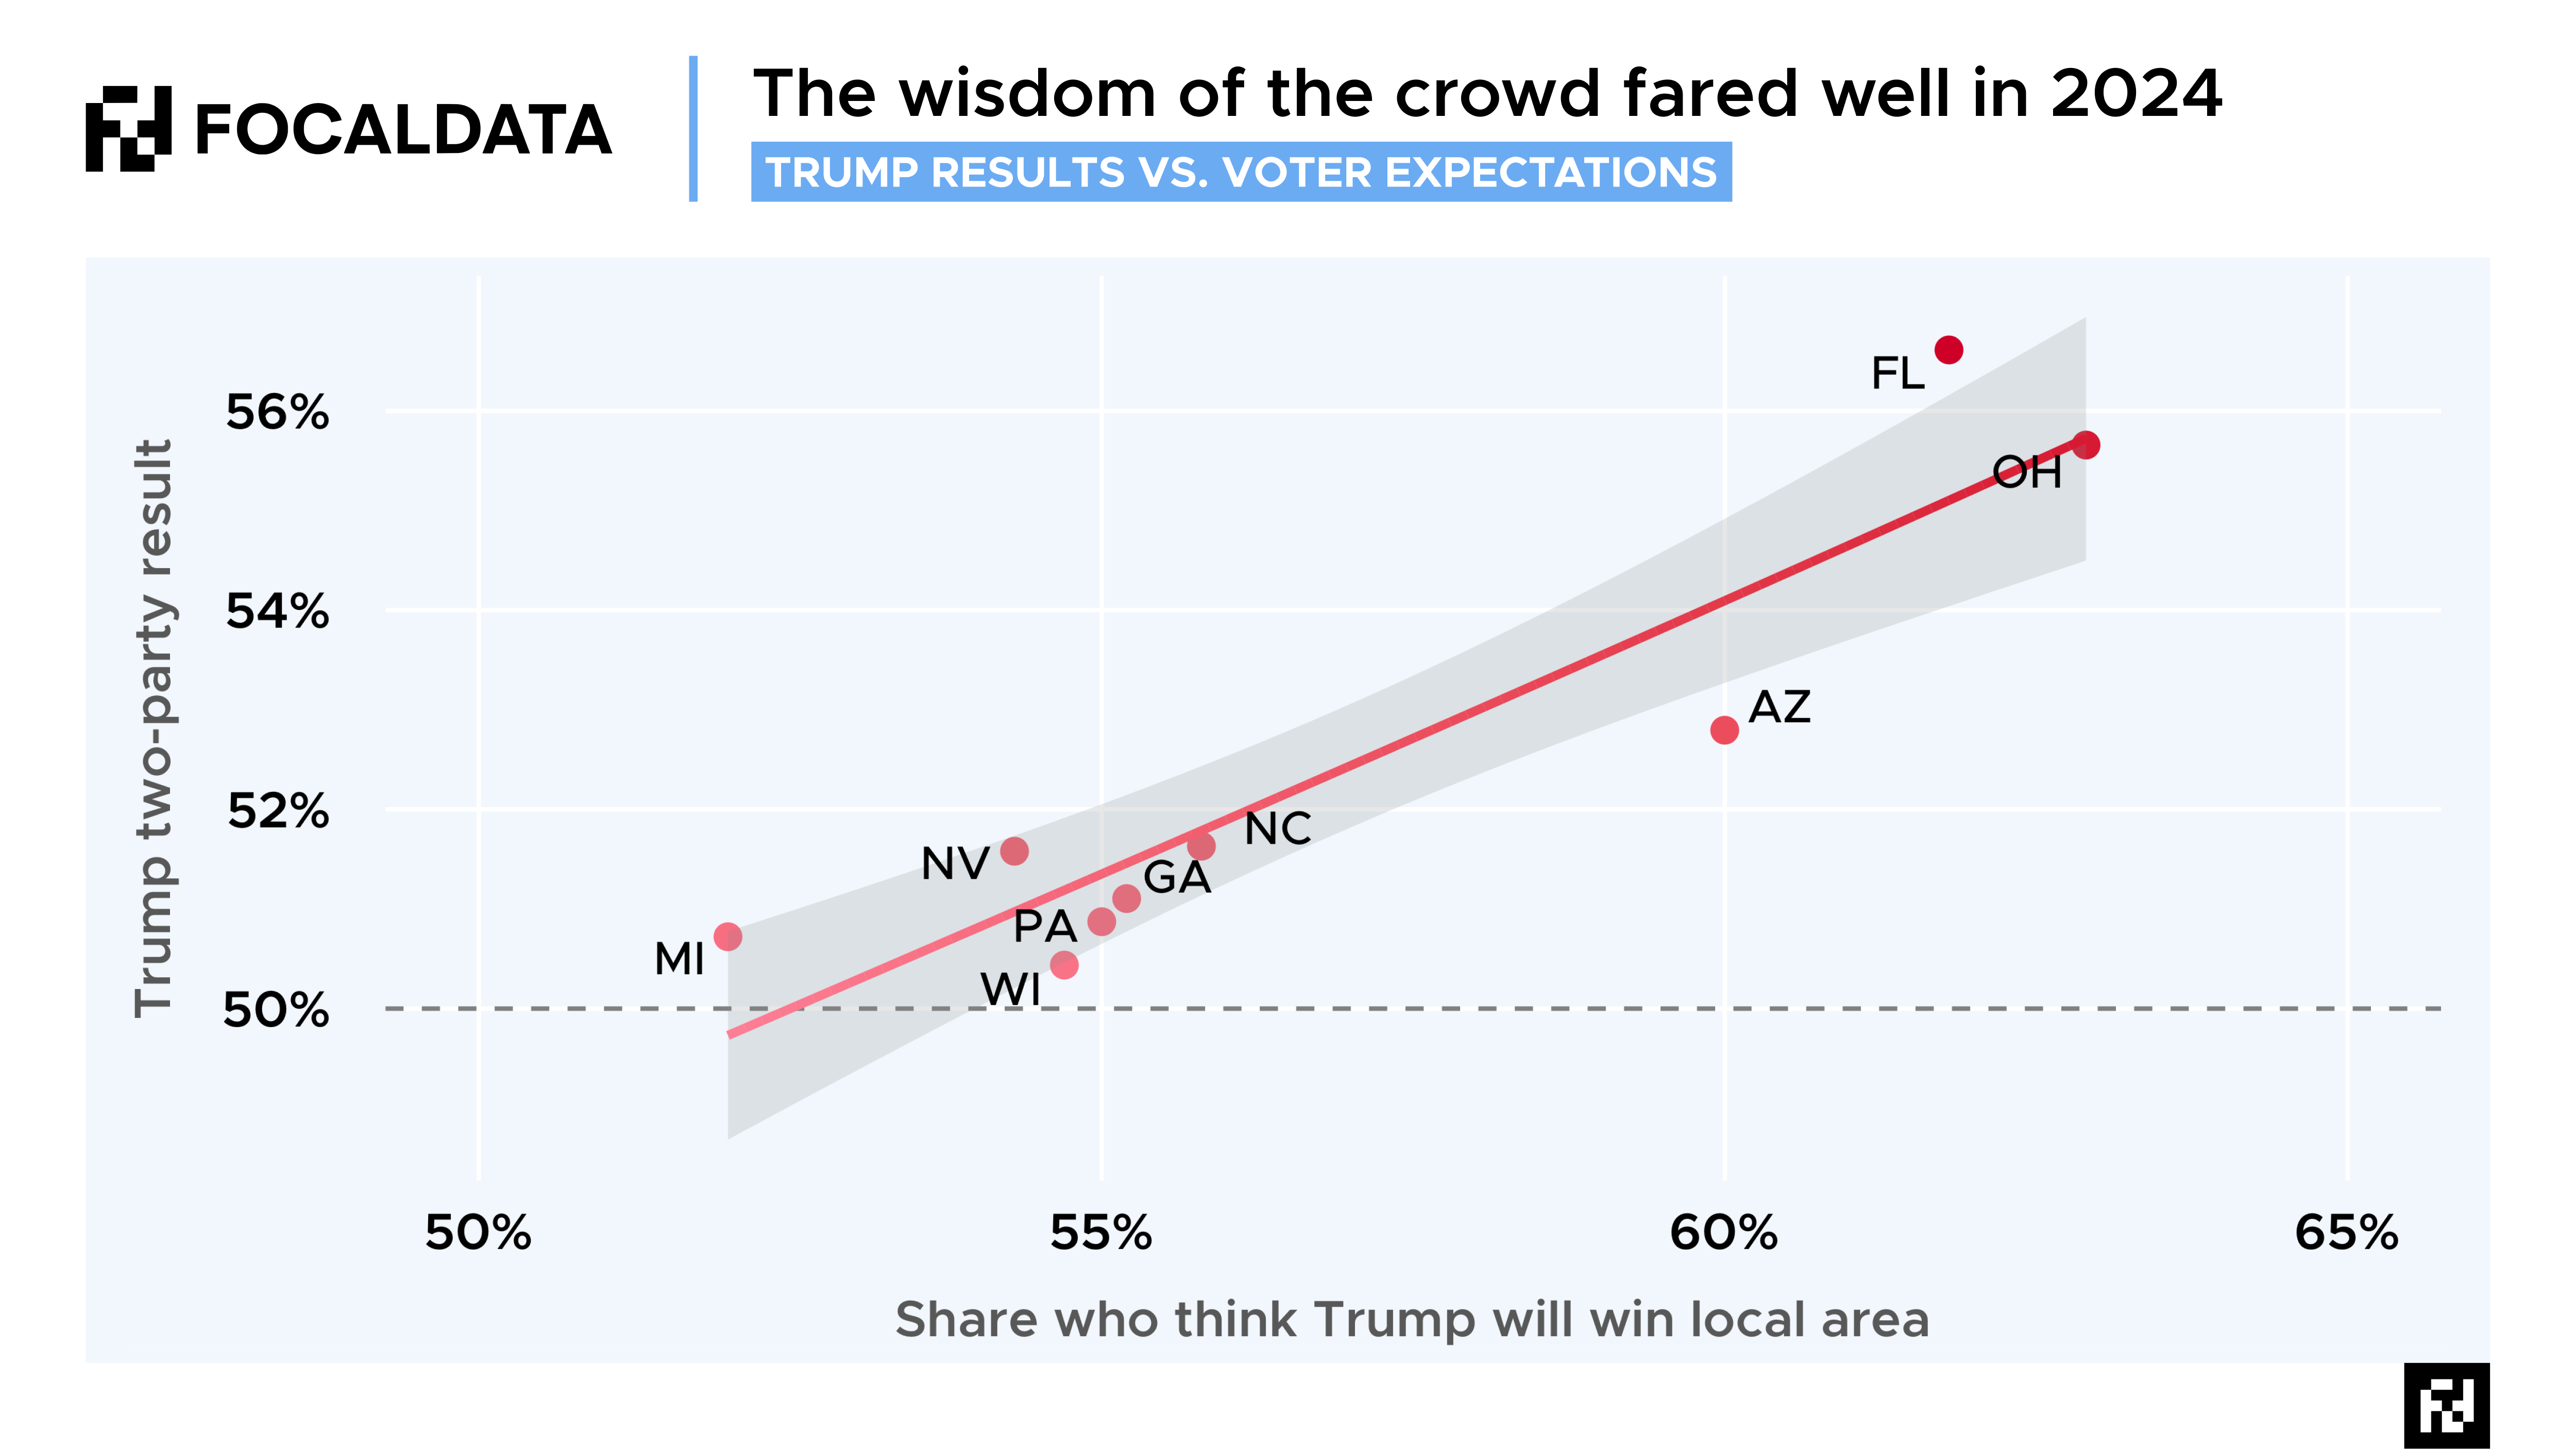
So what to do? We need to be radical and more imaginative with both our data inputs and our post-processing. We will be developing ways to combat non-response bias going forward, but in the meantime, one data source that was correct once again in November was the voters themselves, in a phenomenon known as ‘wisdom the crowds’. In all seven swing states in the US election, most voters correctly thought Trump would win in their local area, a significant divergence from the headline voting intention numbers.
There are competing theories as to why this happened – one which assumes non-response bias is at play and one which does not. The latter – the ‘shy Trump voter’ theory – suggests that Trump supporters will still answer polls, but many do not want to reveal their preferences to pollsters, though they may implicitly do so when asked how their neighbours will vote. The former suggests that Trump-inclined Republicans are less likely to answer polls than the more moderate wing of the party (likely due to lower social trust among hardcore Trump supporters), but their neighbours can compensate for their absence by estimating how their community will vote.
A similar thing is at work in so-called ‘voter expectations’ modelling (we wrote about it here). It got extremely close to the real results in 2015, 2017 and 2019 in the UK. It might take some humility for pollsters to drop the complicated weighting schemes and sampling frames, but recent history suggests that there is a lot to say for trusting the voters themselves. With AI, we are also unlocking new ways to get to the heart of voters’ views, unfiltered, through methods like qualitative research at-scale. It would not be surprising if some of the best predictive models in 2028 are synthesising quantitative datapoints and millions of words from qualitative transcripts, amid myriad other sources like the wisdom of the crowds.

Turning briefly to post-processing, there is now a lot of evidence that modelling techniques such as MRP fare better than untreated polls when predicting election outcomes. This is because they ensure we have modelled estimates for millions of demographic cells across the country, and better account for non-response bias. Throughout the US election campaign, our MRP pointed towards a better result for Trump than public polling. Likewise, MRP polling in the UK typically got a closer result than traditional voting intention polls. While there is still work to be done to refine MRP, we can confidently say after a year of running MRP in multiple geographies (on top of the last ten years), that the method generates a more accurate picture of public opinion than a simple poll, run close to election day.
Polling is, in the words of Michael A. Bailey’s brilliant book from earlier this year, ‘at a crossroads’. Playing a part in developing what comes next and solving the industry’s challenges is a very exciting prospect, and we can’t wait to get stuck in.
Let's call it fragmentation, not depolarisation
A big public opinion mega-theme this year has been the phenomenon of ‘racial depolarisation’. Or the differences in how white and non-white voters think and vote. Longitudinal studies have been suggesting for a long-time that a rapprochement is occurring between minority groups and white groups (see the BES in the UK and ANES in the US). Because this year was also a year of elections, we have had troves of real-time lab experiments and voting data to sink our teeth into. Reflecting on these over the past weeks and months, it’s true that Trump gained gains among minorities, while Conservatives did relatively less badly among certain minority groups in July, most notably Hindu voters.
But what do we actually mean when we talk about depolarisation? Is it something that happens within groups or between them? Our work this year suggests that a note of caution should be sounded over the story of a sweeping racial realignment. Certainly, we need to be careful how we characterise it.
Let’s look at the UK first. In July, Labour suffered its worst result on record with non-white voters. Lots was made of the fact that Labour shed 28 points with Muslim voters, and an average of 18pp across all minority groups. Less was made, however, of the fact that many of these Labour votes were lent to other left-leaning parties, including the Greens and Lib Dems. Overall, this left-leaning ‘bloc’ achieved 66% among ethnic minorities compared to 26% for ‘right-leaning’ parties (Conservatives + Reform). The equivalent figures for white voters were 53% and 41%. We should not underestimate how poorly the right performs, and how well the left does, amongst minority groups.
However, the most interesting stories emerge when we pick out what is happening within groups. If there is anything driving this rapprochement, it’s a constellation of micro-stories that net out at the level of overall trend, but have very different drivers and features. For example, we found in our analysis that the political values of British Indians and British Chinese voters, and to a lesser extent British African voters, are very different to British Caribbeans and Muslims. The former are drifting to the right, the latter to the left. Depolarisation only appears to be happening in some places, for some people.
Turning to the US, Trump’s improvements among Black and Latino or Hispanic voters do not meet the threshold of a sharp realignment. First of all, the inroads Trump made among these voter groups were made predominantly among men and/or non-college voters. This made the Latino or Hispanic community the most divided in terms of gender-based differences in opinion at the 2024 election, with a 34-point gap between men and women. Between white men and women, the gap was 15-points. This is fragmentation rather than depolarisation; non-white groups are splintering into smaller groups based on more complex interactions, cohort effects, national origins and locale. These interactions may produce overall results that solicit comparison to white voters, but the drivers are different and the in-group differences are notably sharper.
As a final aside, it’s worth noting that this year’s shift in the Hispanic or Latino vote was only slightly more emphatic than the Bush-Kerry election of 2004. The Democratic vote among Latinos bounced back then. If fragmentation equals a shattering of previous group-based voter loyalties, we need to be as prepared for relapses, earthquakes and ‘slinky’ politics – and have the right frames and lenses to hand to interpret the results.
Living in a zero-sum world
There is one concept at the intersection of research, culture and politics which we've spent a great deal of time thinking about this year. This is the idea of zero-sum thinking. It packages trends that have been a feature of Western politics for some time, including growing pessimism with political systems, institutions and the sense that future generations will inherit a more problem-ridden world than their parents did. In a multi-country study from April 2024, we found that the UK exhibited the most zero-sum attitudes out of all the other European countries surveyed. The particular question we used was ‘To what extent do you agree that in the economy, one person’s gain always comes at another’s expense?’ We found 59% to 17% agreement.
The idea of 'zero-sum thinking' is not just a useful hypernym. It describes a new axis cutting through Western politics, with younger voters, white voters, rural voters all more likely to be zero-sum. As you can glean from that list, it does not map neatly onto traditional left-right divides. At the same time, being highly zero-sum is highly predictive of embracing populist-right politics (which conveniently doesn’t sit neatly in traditional political science party classifications either).
In a piece we published earlier this year, we alighted on the concept as a short-hand to explain the new public opinion mood, the convulsive capricious atmosphere of the late 2010s and 2020s. This era comes after the age of economics (1990s-2000s) – ‘it’s the economy stupid!’, followed by the age of social movements (2010s). This new age – which we called ‘culturenomics’ (all rights reserved!) – refers to the fusion of culture war issues with explicit cost-benefit trade-offs. Examples include: net zero, debates around hiring and equal pay, overseas aid, immigration, the expansion of higher education and affirmative action. A lot of these sound like culture war issues but they are not. By introducing explicit costs, culturenomic issues activate zero-sum thinking and create unexpected but potentially noxious issue linkages, e.g. between Net Zero and economic growth.
While zero-sum thinking is an output, the inputs are clear: long-term economic stagnation, falling living standards and mismatches between educational attainment and the realities of the job market. It’s no surprise that, in a paper Harvard put out on the topic in March, one of the strongest predictors of zero-sum thinking was having a post-graduate degree.
The task confronting governments is how to take on zero-sum thinking in a world where quick fixes on growth are out-of-reach. This will mean confronting the real economic trade-offs built into debates around immigration, growth, climate change and equal opportunities. The quality of public debate may be all the better for it.


